Subscribe to Blog via Email
Good Stats Bad Stats
Search Text
June 2026 S M T W T F S 1 2 3 4 5 6 7 8 9 10 11 12 13 14 15 16 17 18 19 20 21 22 23 24 25 26 27 28 29 30 -
Recent Posts
goodstatsbadstats.com
Education and Unemployment
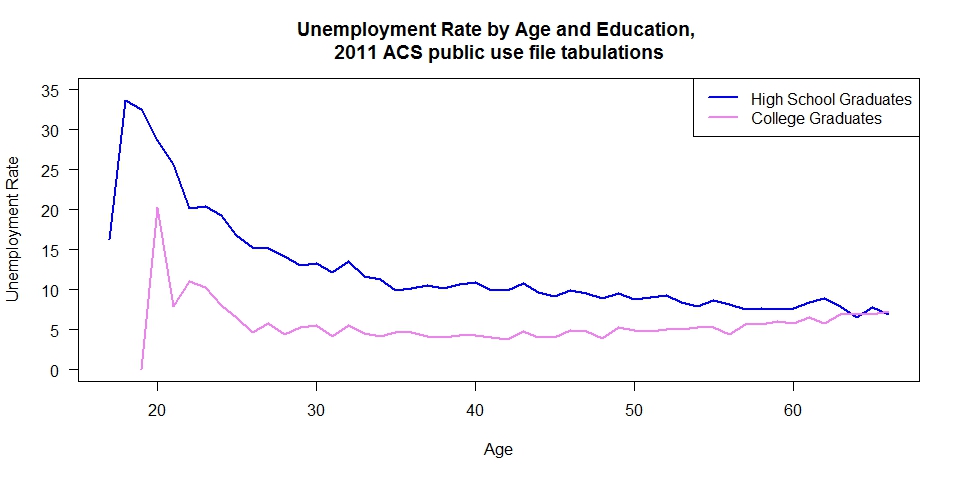 I posted earlier today on the issue of education and unemployment. In that post I suggested the a plot of the unemployment rate vs age by education would be a better plot than the one shown over at Calculated Risk. The plot above show that data based on calculations I did today using the 2011 public use files for the American Community Survey.
In order to keep the concepts simple there are only two groups shown. The line is blue is the rate for those with only a regular high school diploma. I did not include those who have earned a GED or those who went on to get at least a partial college education. I did not include either those currently enrolled in school. Similarly for the college graduates I included only those with a college degree. I excluded those with advanced degrees and those currently enrolled in school. Thus the comparison is strictly focused on the advantage of of college degree as opposed to a high school diploma.
The graph shows the unemployment rate by singe year of age starting at age 16 and going up to age 66. It clearly shows that at all age levels those with a college degree hold a clear advantage over those with just a high school diploma by several percentage points during most of their working life. It is not until age 45 that the difference in unemployment rates drops below five percentage points.
Thus from the employment perspective there is every incentive to go on and get the college degree.
Some limitations still apply. The plot is focused in the middle of the present recession and thus the advantage may not be as great during the boom years. Also the advantage is very likely a function of the field of study for the college degree.
The next project will be to start looking at the income data out of the American Community Survey. Had I realized how easy it would be to create the plot above I would have gone ahead and done the work needed to include it in my first post on the subject.
Posted in Methodolgy Issues, Telling the Full Story, Where's the Data?
Isn’t this data tainted by the fact that college graduates, as a group, are to a least some extent selected for ability? Finishing your education with a high school diploma or going on to complete a college degree is not a random variable; those who leave at high school are likely to be less able in comparison to those in the college degree group.
Can we really ascribe the scale of the difference to the difference in education rather than the difference in ability?
You are absolutely right Jack. Clearly ability it another factor that should be taken into the equation.
The assumption on this graphic would be that those with greater abilities are less likely to be unemployed. I’m working on another post, hope to get it up later today, that will link education and income. There the “ability” effect may be even larger. Certainly there are those who make good money who stop with a high school education.
Agreeing on what is good data on ability is not an easy matter. And getting that data in a way that is linked to education, employment and income is harder still.
Larry – appreciate you pulling out the data. I want to draw attention to the fact that college graduates in the early twenties have unemployment rates approximately as high as high school graduates in their 30s or above. This chart illustrates my point that an average unemployment rate over all age groups obscures the big spike around graduation date. This chart is just for one year – would be interesting to see how this relationship has evolved. I’m concerned about the cohorts from the Great Recession. If you’re not holding a job soon after college, I think the chance that you’re holding a job five or ten years later is slimmer.
Two other points worth mentioning: (a) I’m assuming the definition of employment here is very lax, i.e. college graduates are counted as employed if they have part time jobs or if they have jobs that don’t require a college degree (like waiting tables); and (b) this type of analysis assumes that the economy will somehow generate more jobs requiring college degrees if colleges produce more graduates.
Class, anyone? Throw in some family-income data and let’s see what happens.