Subscribe to Blog via Email
Good Stats Bad Stats
Search Text
July 2026 S M T W T F S 1 2 3 4 5 6 7 8 9 10 11 12 13 14 15 16 17 18 19 20 21 22 23 24 25 26 27 28 29 30 31 -
Recent Posts
goodstatsbadstats.com
When a forcast is not a forcast
The National Weather Service, using data provided by the US Geological Survey, posts on the web data and forecasts for many rivers in the United State. Earlier this year I was looking at the forecasts for the river levels at St. Louis on the Mississippi River. The current forecast can be found here.
The problem is that the charts and associated data files are not really forecasts. The key is a note at the bottom of each graph that says.
NOTE: River forecasts for this location take into account past precipitation and the precipitation amounts expected approximately 24 hours into the future from the forecast issuance time.
 What the graph shows apparently is the forecasts with the assumption that takes into consideration rains that are predicted to occur within the next 48 hours. But then they assume no rain after that time. This would not be so bad except that the graphs frequently predict the water levels out a full three weeks into the future. This means that the forecast frequently predict lower water levels than occur. That can be bad in the winter months – such as last winter when record low water levels were forecast and the Federal Government was spending tax dollars trying to make sure that the river remained navigable for the barges the travel the river. Such forecasts can encourage spending that may not be necessary. On the other hand in time when the river is a flood stage the forecasts will tend to predict that the river will fall below flood stage much sooner that what will actually happen.
The three graphs on the right that were posted at the website illustrate the problem using the data for the Mississippi River at St. Louis. I have not looked at the situation at other river gauge locations.
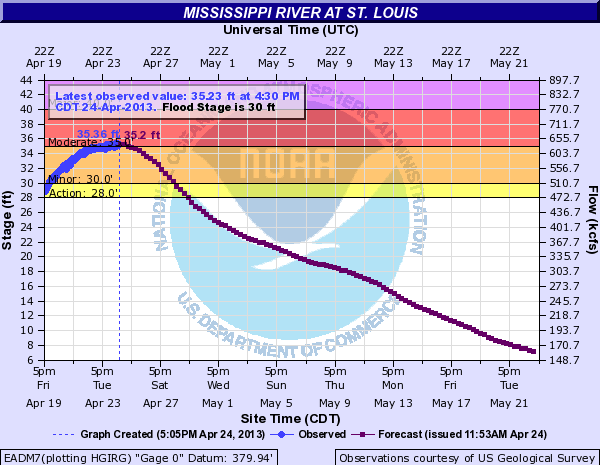
 In the first graph was downloaded from the site on April 24 of this year. At that time the river level was at 35.36 feet. That was about five feet above the flood stage of 30 feet. The forecast at that time was for the river to fall below flood stage six days later on April 30.
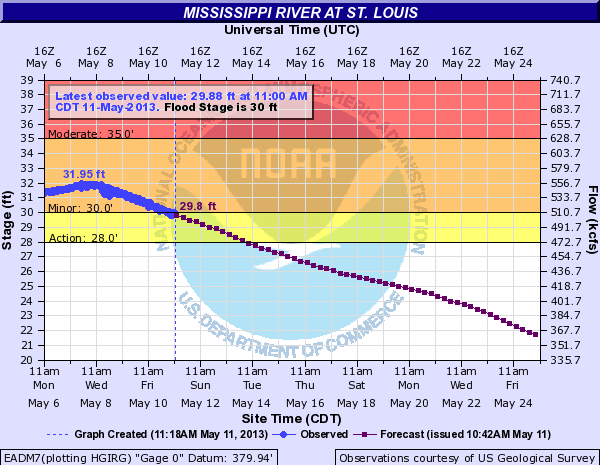
The second graphic is from May 11th and show that the river had just then fallen to 30 feet. That was an error of eleven day. It took the river three times as long as the forecast claimed to reach that level.
But the story continues. According to the original forecast the river level would fall to about eight feet on May 22. The May 11 forecast revised that to 18 feet. That is a big difference.
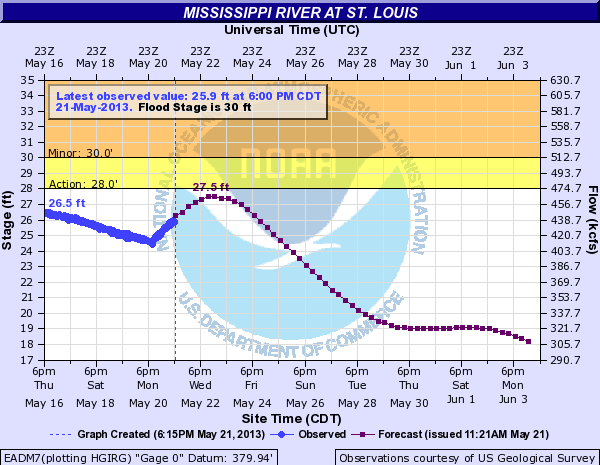
I forgot to download the graphic for May 22, but did get the one for May 21. That graphic for that date is shown on the right. At that time the river level was at 25.9 feet an rising.
 NOAA need to rethink what they are posting. If they insist on using only the forecast of precipitation within the next 24 hours then the forecast graph need to be restricted to a much shorter time frame. Alternately they could do some modeling based on past history as well as utilize some longer range weather forecasts to incorporate more realistic estimates of precipitation amounts and the resulting impact on the river levels.
Posted in Graphics Visualization, Methodolgy Issues
I am publicising you again and wil do so each time you write.
Keep it up!
Thanks again. You were quick this time.
Larry Bad Bad boy nothing to highlight this week!!