Subscribe to Blog via Email
Good Stats Bad Stats
Search Text
April 2025 S M T W T F S 1 2 3 4 5 6 7 8 9 10 11 12 13 14 15 16 17 18 19 20 21 22 23 24 25 26 27 28 29 30 -
Recent Posts
goodstatsbadstats.com
Do you really know the number that accurately?
I was looking at the list of potentially hazardous asteroids at spaceweather.com yesterday. The site provides a variety of information on the state of the sun, aurora forecasts, on current and future comets, and at the bottom of the page they provide a table listing recent and upcoming earth-asteroid encounters. It is a neat and very useful/interesting site for those interested in such things.
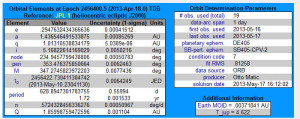
 I went on and looked at the details for one of the asteroids. These can be found by clicking on the asteroid name in the table. On of the neat things is that it provides a graphic of the orbit of the asteroids that one can play around with. They do the same thing when they provide information of current comments. It is a very neat feature of the site. But I was dismayed when I noted how accurately they show the orbit elements of the asteroid. Well, they don’t really claim to know the orbit with great accuracy, they just show the numbers as if they did know. The table at the right is the data for asteroid 2013 KA. The site is good in that is provides both the individual orbital elements and a measure of the accuracy each of those elements. But there is a serious disconect between the claimed accuracy and the accuracy that is shown for the individual orbital elements.
As an example they tell me that the semi-major axis of the orbit is 1.436546491533875. I get sixteen digits of accuracy. But then they tell me that the standard error on that number is 0.00085269. In short they only have the semi-major axis measured to an accuracy of about three decimal places. So why tell me the number to fifteen decimal places? Now the units of measurement here are astronomical units. An astronomical unit is approximately 93 million miles. So they know the number to about 9,300 miles. But they give me the number to an implied accuracy of about five thousandths of an inch. Something is very wrong here.
Posted in Small Differences
Shouldnt we be looking at the Standard Error of the mean and thereby take into account the number of observations conducted to esitimate each parameter.
Being from a different field i am genuinely confused about how this is interpreted in the natural sciences.
You have it right Ham,
The column labeled “Uncertainty (1-sigma)” is their measure of the standard error. That is the value 0.00085269 I referred to. Given they give that number to four decimal places there is justification for showing the value of the measure of the semi-major axis to fifteen decimal places. The same logic applies to the other orbital elements they show in the table.
They show the number of observations used to fit the model in the table on the right in the figure. For this particular asteroid it is nineteen. That number is hard to digest as the quality of the fit depend on the spacing between observations and where in the orbit the observations were taken. Further complicating the situation is that as the object makes a close pass to a third body, in this case the Earth, the value of the orbital elements will change. The size of the change is dependent on how close the object passes to the Earth and the velocity of the Earth.
Thanks for your swift reply. I wouldve have taken Sigma to mean the standard deviation rather than the standard error. But i see the error of my ways…
Using an insane number of decimal places just because the stats program spits them out is regrettably rather common. I personally prefer seeing upper and lower confidence bounds (or a nice visualition). Makes it very clear just how inaccurate data often is.