Subscribe to Blog via Email
Good Stats Bad Stats
Search Text
June 2026 S M T W T F S 1 2 3 4 5 6 7 8 9 10 11 12 13 14 15 16 17 18 19 20 21 22 23 24 25 26 27 28 29 30 -
Recent Posts
goodstatsbadstats.com
Drinking and Driving – Let the Battle Begin
The National Transportation Safety Board (NTSB) released a report yesterday titled: Reaching Zero: Actions to Eliminate Alcohol – Impaired Driving. There were numerous recommendations and a good bit of data on a number of actions that could be taken to reduce traffic fatalities related to alcohol consumption. One recommendation garnered a good deal of media and industry attention. That was the recommendation to reduce the level of blood alcohol concentration (BAC) from 0.08 to 0.05.
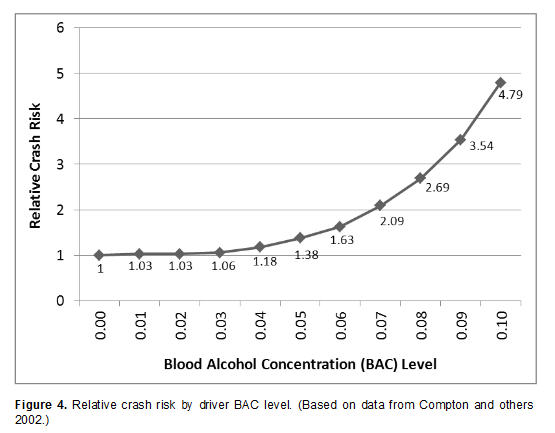 There were two charts in the NTSB report that are most useful in understanding the current situation as it relates to drinking and driving. The first showed the risk of a fatality as a function of the BAC. That graphic is shown on the right. This graphic shows that the relative risk is quite high at the current 0.08 limit. In fact it is also quite high at a 0.07 level. The NTSB clearly feels that the a risk factor of 1.38 at the 0.05 level is high enough to justify classifying those driving at that level as impaired.
Most of the rest of the developed world seems to agree with the NTSB as many countries currently set the limit at 0.05. The World Health Organization is also in agreement with the 0.05 level. Clearly reasonable people have considered the facts and arrived at 0.05 as a reasonable level.
But has the NTSB made a good case for the proposed lowering of the limit? Certainly with close to a third of all traffic fatalities related the alcohol use the level is much too high and current methods to reduce that level are not effective. The current level of 10,000 deaths a year due to alcohol and driving is clearly unacceptable. We as a country would be outraged if 10,000 people a year were dying from any other preventable cause. Just consider the reaction any time there is an e-coli outbreak due to tainted items in the food chain.
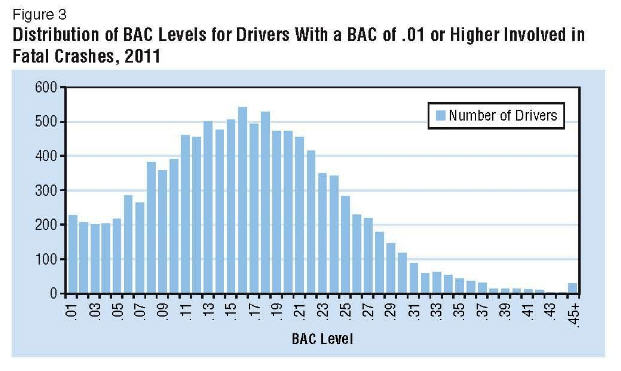 The figure at the right, also taken from the NTSB report, shows the distribution of traffic fatalities by BAC level. This chart shows that about 1,000 fatalities can be attributed to situations where the BAC was 0.05 to 0.05.
A major weakness in the report is the failure to provide detailed numbers for that group of people. The breakdowns are almost universally 0.01 to 0.07, and levels above 0.07. The 0.05 to 0.07 level is the targeted group in the recommendation so more detailed data on that group needs to have have been included. The additional weakness in the analysis is any clear linkage to the number of fatalities that would be eliminated by lowering the level. No method is going to eliminate all fatalities in that group. Three will always be first offenders who cause fatalities. At the same time a reduction in the threshold BAC level would likely reduce fatalities in some of the other parts of the distribution.
Meanwhile the American Beverage Institute has reacted vigorously to the propose lowering of the BAC criterion. They have describe the proposal as ludicrous. That is a strong word and in my mind should not be used in the middle of a serious discussion of issues such as this. Never the less it does show their level of concern. Of course they do have a vested interest in protecting the profits of the alcohol and restaurant industries. Their first responsibility is not in protecting the lives of those on the road of this country.
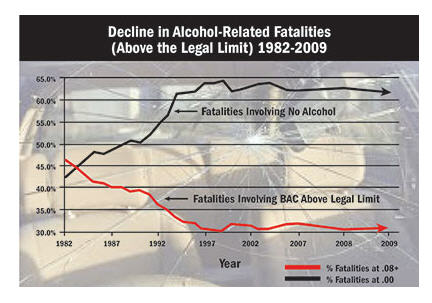 Unfortunately the American Beverage Institute did not bring any data to bear on the discussion in support of their position. Surfing their web sites it becomes immediate clear that their main goal to protect the industry from anything that would impact the sale of alcoholic beverages. One of their web sites even focused on “Bad Stats.” When they attack the statistics of their opponents they need to ensure that their own statistics are clean. They failed to do that with the graphic to the right taken from their negligent driving web site. What stands out here is that a site devoted to the issue of negligent driving makes as its only home page issue the case that driving and driving is no longer the issue.
There are numerous problems with the chart. Start with the title: “Decline in Alcohol-Related Fatalities 1982-2011.” The chart shows only percentages. There are no counts. So the chart cannot show the actual decline in alcohol-related fatalities that has occured. By using their title they create in the chart the implication of an increase in the number of non alcohol-related fatalities in the same time period. The truth is that the two percentages should add to 100%. A decrease on one percentage will be offset by an increase in the other. Then they cut off the lower limit of that chart at 30% giving the mistaken impression that the alcohol-related fatalities is at a very low level when just about anyone should consider 30% to be unacceptable high.
A change to the legal BAC level, if it happens, will likely take years to implement. The arguments will bring forth a wealth of associated information and misinformation. I wait to see how the issue will evolve.
Posted in Data Quality, Telling the Full Story
I do hope you are getting visitors from downunder.
you keep writing and i will keep publicising them here!