Subscribe to Blog via Email
Good Stats Bad Stats
Search Text
July 2026 S M T W T F S 1 2 3 4 5 6 7 8 9 10 11 12 13 14 15 16 17 18 19 20 21 22 23 24 25 26 27 28 29 30 31 -
Recent Posts
Good Stats Bad Stats
goodstatsbadstats.com
Cluttered graphics
Accuweather likes to provide little weather graphics showing previous weather events or what they call the worst weather of the day. Today the worst weather was in Shark Rock, WA. What as it? – Rain. That seems rather mundane to me unless they are getting flooded of course. But then I would expect them to tell me that the worst weather was flooding. Somehow the very common does not meet my qualifications for “worst.”
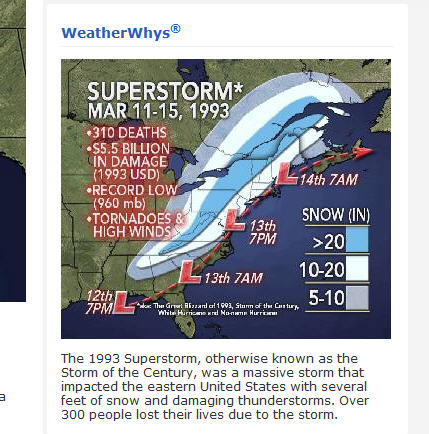 But what got my attentions today was the graphic reproduced at the right. Now I know they go for nice images and the like. Their goal seems to be more what they can make looks nice rather than providing good informative graphics.
In this case the graphic has several shortcomings. Start with clutter. Most of the text on the left can be easily eliminated. The “more than 300 deaths” is already covered in the details at the bottom. It does not need to be repeated twice. Adding the word “tornadoes” the the description at the bottom eliminates a second line. It is necesary to show the position of the center of the low pressure system at 7 AM each day. That can go as well.
The data they give is also problematic. The record low pressure is not well defined. Hurricanes frequently have lower central pressures. They can come in at under 900 mb. So what kind of record are they referring to with a pressure of 960 mb? Then the cost figure of $5.5 billion is given in 1993 dollars. There is really no excuse for not putting that number in current dollars.
They can do better.
Posted in Uncategorized
A cluster of birth defects
I’m not sure why the story got the media’s attentions this past week on what CNN refereed to as a “Mysterious cluster of birth defects” in Washington state. The story was also picked up by NBC News, Fox News, and others. The cluster was studied and reported on by the Centers for Disease Control (CDC)in July of 2013 and again in September of 2013. The CDC was unable to find a cause for the cluster of birth defects. The birth defect was anencephaly where the baby is born missing parts of their brain and skull.
Clusters such as this one are always hard to investigate. Rare events do happen. It only takes 23 people in room to have an 50 percent probability that two of those people share the same day of the year for their birthday. Statistics surprise and can be very counter intuitive. Many people have problems accepting that it only take 23 people to get to an equal probability of such an occurrence.
Computing probabilities can be very difficult in these types of situations. The investigation in this particular situation apparently started when a nurse notice two incidents with in the hospital where she was working and then discovered a third event in a nearby hospital while talking with a colleague.
Rare events happen. The CDC report tells us that the national rate for anencephaly is about 2.1 cases per 10,000 births. But there are millions of births per year. So is two cases in one hospital, or there cases in one area in a short period of time an anomaly?
The next step was when the state department of health reviewed the records for a three county area over a three year time span and found 23 cases. This translated into a rate of 8.1 defects per 10,000 births. Well above the national average. If we were to focus only on the 20 new cases that were seen in the state study the rate would still be 7.0 per 10,000 births which is still well above the national average of 2.1. At that point I cease being concerned that the nurse found a random outlier as the unusual number of cases was confirmed within the same geographic area.
The next step in the study was the selection of a random sample of 108 other pregnancies. The only constraints on the selected sample were “a pregnancy without an indication of a structural or genetic birth defect during routine prenatal care and prenatal residence in one of the three study counties.” I am not sure why that approach was used, and what other analysis was done that was not reported on by the state health department and the CDC.
Questions I would have liked to have seen addressed were things like: Did the 23 cases show any type of clustering based on the characteristics of the mother’s health, geography, medical care, and the like? Why was the random sample comprised of only 108 cases – I suspect money drove that decision – at least in part. And why was not a more targeted sample chosen that more closely represented the characteristics of the impacted mothers? Usually when trying to compare two groups reducing the variability within and between the two groups is crucial in reducing the statistical errors inherent in the data. Of course one must always deal with the realities of what data is available to select the sample. Perhaps there was not very much data on the other births in the three county area that would have made a more targeted sample possible. This makes me wonder if the inability to find a cause, if it was not just a random event, was due to the small sample size used and the inherent variability in the populations of pregnant mothers.
Posted in The Media
Obama’s health care promises and costs for small businesses
As I was getting up this morning I turned on the radio. I was hoping for a weather forecast. Instead I got Representative Ann Wagner giving the Weekly Republican Address.
Wagner started by quoting Obama’s 2008 campaign promise to cut premiums for health care by up to $2,500. She saw this a a broken promise based on the recently released report by the Centers for Medicare and Medicaid Services on the premiums for those employed in small businesses. The violation was that premiums were going up for 11 million individuals.
The report was release a week ago and comments and arguments have been going back an fourth for the past week. See here and here for a couple of examples. But what Wagner has to say requires closer scrutiny.
First off Obama’s promise was not well respected when he made it. It seemed like a considerable overestimation of the savings that could be achieved. And Politifact.com listed it as a broken promise back in 2012.
But what exactly did he promise? Well Jay Forest has put together a series of clips of Obama’s various statements while on the campaign trail. He has done us a real service since seeing the videos as a group lets us see what Obama was trying to say. He did not say it the same way every time. Focusing only on what he seemed to repeat again and again the core of the promise was to (1) he had a plan, (2) work with employers, (3) reduce premiums, (4) the reductions would be up to $2,500 for a typical family. Wagner’s version of the promise was to sign a health care law that would “cut the cost of a typical family’s premium by up to $2,500 a year.” I did not see anything where he promised to sign such a law – so Wagner is exaggerating a bit. Regardless of how one reads the promise it really was not much of one. “Up to $2,500” can be anything from zero up to $2,500. And what makes for a “typical family?”
Wagner is stretching the logic to make a claim that the report on the impact on premiums on small business provides evidence of a break in Obama’s promise. Just for starters can we claim those are typical workers? As I read the report they are clearly not. As the report claims and as the CNN report picked up on, small businesses tend for some reason to hire younger and healthier workers than average.
This is important because the Affordable Care Act require some averaging of premiums. Age cannot be factored in as it had been earlier. Health of the workers cannot be factored in as it had been earlier. And preexisting conditions can no longer be excluded. These features tend to force premiums towards the mean. They should reduce the variance in health care cost that exist for a whole set of reasons. Firms where workers or their families had significant medical issues were paying higher premiums. This in turn put them at a disadvantage in competing with other firms not so burdened. Premiums went up on average at least partly because the small businesses with younger and healthier workers were no longer put in such an advantageous position. They also went up because of the new preexisting condition clause in the act. Firms with older workers would expect to see their premiums decrease.
As with any change in technology, law, or practice there are winners and there are losers. Any change to the health care system will see winners and losers. The same is true in the premiums workers and employers will pay under the Affordable Health Care Act. While Wagner was happy to point out the estimated 11 million individuals who’s premiums will go up. She ignored the estimated 6 million individuals that will see a decrease in their premiums. A shortcoming of the report is that while it reports on how many will be impacted it does not tell us how much the premiums will change.
But perhaps Wagner’s biggest statistical blunder was letting the tail wag the dog. What is going on with the approximately 17 million individuals talked about in the report cannot really be used to argue a broken promise (or supposed promise – depending on how you view what Obama actually said) as it applies to the county as a whole.
Posted in How to Lie with Statisics, Methodolgy Issues, The Media