Subscribe to Blog via Email
Good Stats Bad Stats
Search Text
July 2026 S M T W T F S 1 2 3 4 5 6 7 8 9 10 11 12 13 14 15 16 17 18 19 20 21 22 23 24 25 26 27 28 29 30 31 -
Recent Posts
Good Stats Bad Stats
goodstatsbadstats.com
Income inequality – yet another measure
With President Obama visiting the Pope I thought I would go back to a report from about two weeks ago about income inequality in the District of Columbia. The D.C. Fiscal Policy Institute put forth a paper that put the District of Columbia income gap “one of the biggest in the U.S.”
The report started with the statement that the average income of the top 5% of households is the largest among large cities in the U.S. I really don’t care for comparisons that deal with just the raw numbers as the level of income in any local area is very much dependent on the cost of living in that area. The areas like the District of Columbia and San Francisco have higher costs of living numbers. Thus the average income for any group would be expected to be higher in those areas. To compare the various geographic areas adjustments for those differences are needed. That is why many economists rely on the measures like the Gini Index to measure income inequality.
In comparing the various metropolitan areas the D.C Fiscal Policy Institute used their own measure of the income gap. They choose the ratio of the average income of the top 5% to the average income of the bottom 20%. They certainly have the right to choose whatever measure they wish to use. But a multitude of differencing measures, to me at least, creates confusion. There already exists a similar measure to theirs. It is the Palma Index of income inequality. That measure is calculated as the average income of the top 10% to the average income of the bottom 40%. Why not stick with that measure? I suspect because the D.C. Fiscal Policy Institute makes the level of inequality appear worst.
Given that he Palma measure is already in place I don’t see the value of new and essentially similar measure. I do not know of a single measure the captures the true picture of the level of income inequality for comparative purposes. I did come across another interesting piece comparing the Palma Index to the Gini Index. That post was in response to comments about the author’s paper on the Palma Index. Both of the post and the paper are a year old. To my reading the post shows that both the Palma and the Gini have serious shortcomings.
Significant income inequality is real. Measuring it and how it changes is still a work in progress.
Posted in Telling the Full Story, The Media
A potential Alzheimer’s test
Last week there was media abuzz about a potential Alzheimer’s test. The work was led by Howard Federoff, a professor of neurology and executive vice president for health sciences at Georgetown University Medical Center and published in Nature Medicine.
I emailed the author over a week ago and requested a copy of the paper. I have not received a response. My complaint is once again if the authors are willing to give extensive media interviews then the paper should be readily available and not hidden behind a pay wall. The journal is charging $32 for a pdf version of the paper. I understand that journals need to make money. When the audience is the author’s peers, who are likely to subscribe to the journal or work at an institution that subscribes to the journal, then charging for copies makes sense. When the author chooses to make his audience the general public then there is an element of self promotion for both the author and the author’s institutions. In this case Georgetown University was more than happy to publicize the findings on their web site.
After watching the videos and reading a few of the reports that gave at least some description of the research I came away with a number of questions. Those questions may well be answered in the paper. However as I mentioned the author has not responded to my request for a copy of the paper. So I’ll ask my questions here.
For the research 525 people age 70 and over were recruited. Two to three years later an subset those people had developed Alzheimer’s. What the authors tell us is that 53 patients who developed Alzheimer’s were compared to 53 who had not developed the disease.
So question 1 is how the two sets of 53 patients were chosen? A related question is why limit the number without the disease to just 53. That seems to reduce the effectiveness of any analysis. There is nothing in the statistics that demands that the two groups be the same size.
They next searched through 4,000 biomakers and found ten that they linked to the disease. This appears to me to be extreme data mining. Going through 4,000 variables based on 53 patients it seems almost certain that several sets of ten biomarkers could be linked to the disease. Many of these would likely be just due to random chance. So my second question is how the researchers selected the final set of ten biomarkers that they are proposing to use for the test.
Part of the answer to this may be in the validation sample. The description of the validation sample leaves much to be desired. The sample size is only 40 participants. To be a proper validation sample those people must be selected from the original population without knowledge of either the test results or the occurrence of Alzheimer’s. With only 40 cases it would seem that the number of cases of Alzheimer’s that would occur would be much too small for that to serve as a useful validation sample.
We are also told that the test allows prediction with a 90 percent accuracy if a healthy person will develop Alzheimer’s. My next question is what this 90 percent means. My guess, and that is what it is, a guess, is that of 100 patients who show symptoms of the disease within three years will have tested positive. If that is the case what is the false positive rate. In other words of those with a positive test result what percent of those will develop the disease. This is different than asking what percent of those who will develop the disease test positive. This is important because if we are to start treatment for those who test positive we will be treating both those who will develop the disease and those who will not develop the disease. Both ethical and cost considerations come into play in implementing any treatment plan.
The authors offer the possibility of selecting subjects based on their test that then would become subject to drug tests to see if a treatment could prevent or delay the onset of Alzheimer’s. This is the second point at with the false positives become an important factor. In evaluating the effectiveness of the test consideration must be given to the fact that a certain number of subjects will not develop Alzheimer’s because they original screening test identified some subject who never would have developed the disease.
Keep in mind that developing a test that allows for treating the disease prior to the actual onset of the disease is a dream. It is something that works well with vaccines. That is why we take medicines to reduce blood pressure to prevent heart disease and other illnesses. Can it work with Alzheimer’s? That is the unknown.
Questions, questions, questions – if only the paper were readily available.
Posted in Telling the Full Story, The Media, Where's the Data?
Probabilities and the Warren Buffett March madness challenge
 Warren Buffett has put forth a challenge for anyone to try to pick the winners of all 63 matches in the March madness NCAA tournament.
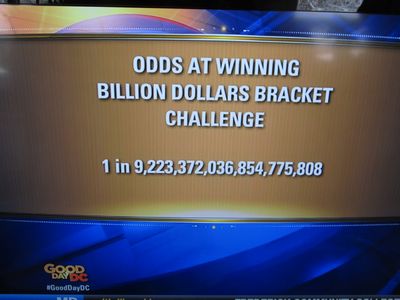
The odds of getting it right were quoted as anywhere from one in 4,294,967,296 or one in 9,223,372,036,854,775,808 at the Forbes website. The one in 9,223,372,036,854,775,808 seems to have gotten a lot of play in the media. The local Fox network station showed the graphic at the right and went to great lengths about it. It is a screen capture from their broadcast that is shown at the right.
In truth the one in 9,223,372,036,854,775,808 figure is a gross overstatement of the true odds for anyone who knows just about anything about the tournament. Many websites seem to have caught on to that fact. The number was arrived at based on the very simple model that each team has a fifty percent chance of winning each game it plays. But that is simply not true. The likelihood of the number one ranked team in each bracket of winning its first game against the 16th ranked team is much better than that. Anyone playing this game can increase their odds of winning considerably by simply picking the number one ranked team in the first round.
So what is the true probability? That would be almost impossible to calculate. I laugh at the purported accuracy of the one in 4,294,967,296. It truth that number is likely based on some model of the probabilities of winning for each team. And it may even be in the right ball park.
I won’t go to he trouble of playing the game. But if I did my strategy would be one of random selection. The Bayesian in me says use past data to estimate the probabilities for the various match-ups. Thus I would use historical data to get a reasonable approximation of the probability of the team ranked in n-th position beating the m-th ranked team for all pairs (n,m). I would then do a bit of smoothing of the probabilities as I doubt that there is enough data to give fully stable probability estimates. I would not want to be using probabilities where the chance of a 6th ranked team beating a 7th ranked team was less than the probability of the same 6t ranked team beating a 9th ranked team. Next I would pull out my trusty random number generator and make selections at each stage of the tournament based on simple random selections and my set of probabilities. That at the very least avoids any possibilities of my own biases about the various teams slipping into the selection process. It also allows for incorporation of the upsets that happen every year to make it into my selection. It is then a matter of hitting just the right set of upsets.
Posted in Methodolgy Issues, The Media