Subscribe to Blog via Email
Good Stats Bad Stats
Search Text
July 2026 S M T W T F S 1 2 3 4 5 6 7 8 9 10 11 12 13 14 15 16 17 18 19 20 21 22 23 24 25 26 27 28 29 30 31 -
Recent Posts
goodstatsbadstats.com
Cluttered graphics
Accuweather likes to provide little weather graphics showing previous weather events or what they call the worst weather of the day. Today the worst weather was in Shark Rock, WA. What as it? – Rain. That seems rather mundane to me unless they are getting flooded of course. But then I would expect them to tell me that the worst weather was flooding. Somehow the very common does not meet my qualifications for “worst.”
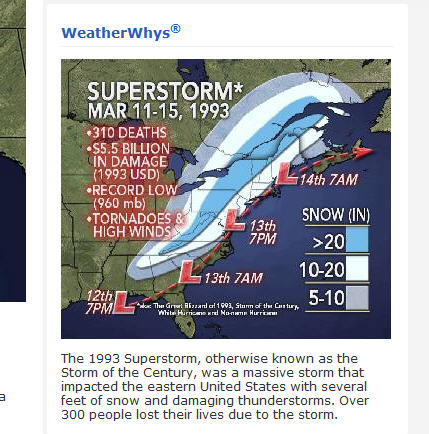 But what got my attentions today was the graphic reproduced at the right. Now I know they go for nice images and the like. Their goal seems to be more what they can make looks nice rather than providing good informative graphics.
In this case the graphic has several shortcomings. Start with clutter. Most of the text on the left can be easily eliminated. The “more than 300 deaths” is already covered in the details at the bottom. It does not need to be repeated twice. Adding the word “tornadoes” the the description at the bottom eliminates a second line. It is necesary to show the position of the center of the low pressure system at 7 AM each day. That can go as well.
The data they give is also problematic. The record low pressure is not well defined. Hurricanes frequently have lower central pressures. They can come in at under 900 mb. So what kind of record are they referring to with a pressure of 960 mb? Then the cost figure of $5.5 billion is given in 1993 dollars. There is really no excuse for not putting that number in current dollars.
They can do better.
Posted in Uncategorized