Subscribe to Blog via Email
Good Stats Bad Stats
Search Text
April 2025 S M T W T F S 1 2 3 4 5 6 7 8 9 10 11 12 13 14 15 16 17 18 19 20 21 22 23 24 25 26 27 28 29 30 -
Recent Posts
goodstatsbadstats.com
Deception on the Campaign Trail
Romney, Wilmington Delaware, April 10, 2012:
“Do you know how many women – what percent of the job losses were women? 92.3 percent of the job losses during the Obama years has been women who’ve lost those jobs. The real war on women has been the job losses as a result of the Obama economy,”
Rating: Selective use of statistics to mislead the voters.
A video of Romney’s actual remarks can be seen here. A description of the numbers he is talking about is given here.
The numbers that Romney is using are based on the Bureau of Labor Statistics monthly Employment Survey. He is looking at total nonfarm jobs on two dates – January 2009 when Obama took office and March 2012 which are the latest numbers available from the Bureau of Labor Statistics. The job loss figures used to arrive at the 92.3 percent figure is the net difference between those two dates. They measure jobs, not people with job. The difference is not a measure of jobs loss, but of the net difference between the two dates. Thus the hundreds of temporary jobs created for the 2010 Decennial Census are not include as either job gains or job losses.

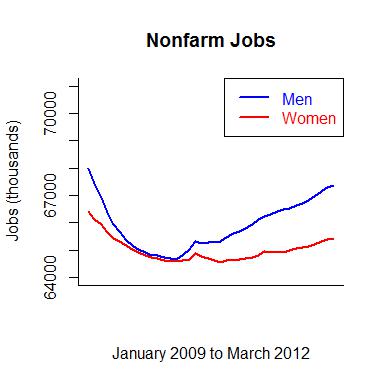
 So Romney wants to blame Obama for the net loss of 683,000 jobs for woman in that time interval and the net loss of 57,000 jobs that men in the same time interval. That results in the 92.3 percent figure he cites. A graph of the time series for both men and woman is posted to the right. Be careful in viewing the graph as the vertical axis does not go all the way to zero. If it did the loss of jobs would mostly be hidden from five. In this time frame it is clear that men suffered worst then the woman in net job losses and also have gained back their losses to a greater extent. If we really want to talk about job losses then the measure is from the peak to the valley in the graph which happened mostly within the first year of the Obama administration. Then there is a gain in the number of jobs over the last two years.
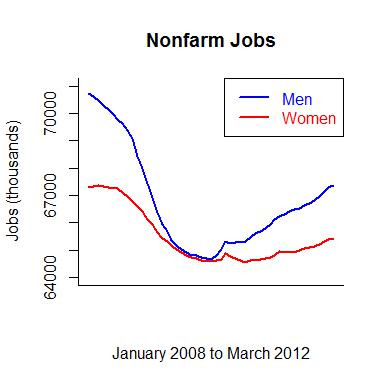
The real problem with the statement and with the graph is that they do not tell the entire story. Rarely can a president be blamed for job losses during the first few months that they are in office. The recession was well underway before January 2009. The numbers fail to show what was happening prior to that time. So the second graph on the right shows the same numbers on the same scale but starts the time series a year earlier at the beginning of the final year of the Bush administration.
That graph tells a very different story. The much larger job losses for both men and woman during 2008 are now clearly evident. Also clear is that men suffered job losses much larger than those that the woman suffered. The men have yet to make up for their larger loses.
To put the situation in perspective Romney is talking about a loss of 740,000 jobs over three years while Obama has been in office. While in the last year of the Bush administration between January 2008 and 2008 there was a loss of 4.4 million jobs. That is a much bigger loss. Perhaps Romney and the Republicans want to take credit for those job losses. Those loss disproportionally impacted men who lost 3.3 million jobs while woman lost 1.1 million jobs.
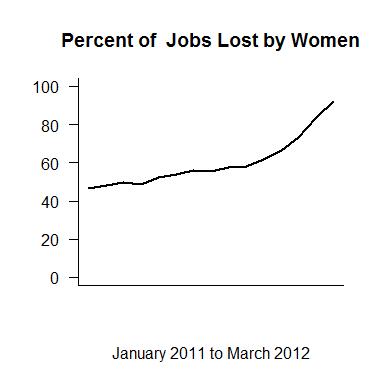
 This entire method Romney used is very badly conceived and executed. The calculations and statements will lead to logical nonsense. The plot to the right illustrates this. Romney should be able to make the equivalent statement each month based on the then currently available data. If he had done so then in January of 2009 he would have said: “46.4 percent of the job losses during the Obama years have been women who’ve lost those jobs.”
The economy has been improving since that time. So the question then is one of job gains not job losses. Yet since then, using method of calculation Romney has devised woman’s job losses have gone from 46.2 percent to 93.4 percent. That percent has shown a steady increase over the last 15 months. Within a couple of months he will be claiming that over 100 percent of all job losers have been woman. And this man claims he understands the economy!
[…] goodstatsbadstats.com About « Deception on the Campaign Trail […]