Subscribe to Blog via Email
Good Stats Bad Stats
Search Text
July 2026 S M T W T F S 1 2 3 4 5 6 7 8 9 10 11 12 13 14 15 16 17 18 19 20 21 22 23 24 25 26 27 28 29 30 31 -
Recent Posts
goodstatsbadstats.com
Recession has further polarized families
Such was the title of a piece in the Washington Post on a report by Zhenchao Qian in the Department of Sociology of The Ohio State University titled: “Divergent Paths of American Families”
The title was actually used in the print edition of the article. The online edition title was “Children suffer from growing economic inequality among families since recession,” Seems like the editors want to just confuse their readers.
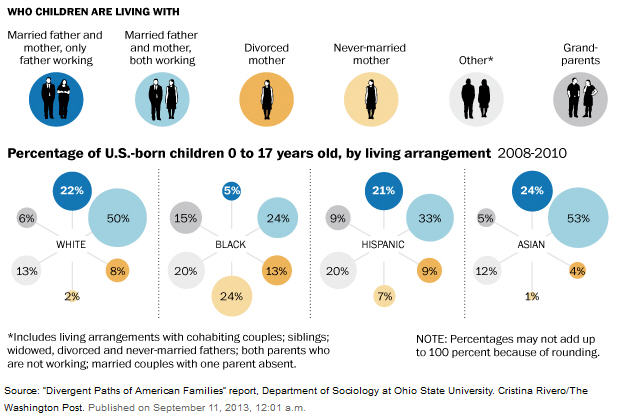 I was initially attracted to the piece by the graphic showing percent of children by family type by race and ethnic groupings. That graphic is shown on the right and the full a graphic is available here. Initially I did not care for the graphic but came to like is a bit better over time. The main reason is that the nature of the differences between the four groups becomes a bit easier to see in the graphic than they do in the table provided in the original report. It does take some study though for the comparisons to become clear. Notice first that there is very little differences in the percent of children in the various family groups between Whites and Asians. That is not so easy to notice at first glance as the two groups are on the two ends of the image. Once having seen the similarity the stark differences in the distribution for the Blacks become readily apparent. The Hispanic group falls between those two set. But their distribution is much closer to that of the Whites and Asians than to the Blacks. That simple difference does not stand out as well in the table as in the graphic.
The interesting thing about the graphic is that it provides absolutely no information about the content of the article in the Post as claimed by either the print or online headline. Also interesting is the imbalance in the graphic. It shows married father and mother with just the father working, but fails to show data for married father and mother with just the mother working. It shows divorce and single mothers, but does not show data for divorce and single fathers. These groups are likely relatively small but the imbalance in the graphic is obvious. In defense of the Washington Post the imbalance caries over from the report.
The big problem with the report is the attempt to link what has happened in society between 2000 and the 2008-2010 period to the “Great Recession.” The term shows up 21 times in the 43 page report so it is no surprise that the Washington Post picked up on the claim of a link to the recent recession. To understand the problem one need first to realize that the official recession started in December 2007, but that the unemployment rate remained below six percent through the summer of 2008. The 2008 data used likely does not reflect very much of the impact of the recession. The actual data for the 2008-2010 time period is from the American Community Survey and is composed of interviews conducted in each of the years 2008, 2009, and 2010. The data at the other end is from the 2000 Census and thus is from eight years prior to the recession. No attempt is made by the author to account for changes between 2000 and 2008. As a result all of the comparison in the table of 2000 data to the 2008-2010 data reflects mostly on what occurred in the years prior to the recession.
There is some attempt to use the 1980 Census data to track overall trends, but these instances mostly support the contention that what happened between 2000 and 2008-2010 are part of ongoing socioeconomic trends rather than from the recent recession.
The report seems to take claimed correlations based on only two data points, 2000 and 2008-2001, with the recession occurring in 2008 and onward as evidence of a causal relationship. Somehow what happened between 2000 and 2007 can be ignored. When things don’t change the author seems to think it fortunate that the recession did not affect that statistic. It is true that in some cases the link is tempered by the use of the term “may.” But the sheer number of times the recession is linked to the data clearly implies a causal relationship.
None of this is justified. The main reason is that there are two effects being reflected in that data. First what happened between 2000 and the start of the recession must me taken into consideration. Only than can what happened during the recession be measured. Some measure may have gotten better between 2000 and 2007 and then taken a turn in the opposite direction as a consequence of the recession. With the data used in this report we only see the sum of these two effects. We have not measured the effect of the recession alone.
Just as importantly correctional does not implies a belief in causation. Two data points only show changes between two points in time that can be linked to any number of causes. When these changes are also in line with ongoing socioeconomic change blaming or crediting the recession for them is not justified.