Subscribe to Blog via Email
Good Stats Bad Stats
Search Text
April 2025 S M T W T F S 1 2 3 4 5 6 7 8 9 10 11 12 13 14 15 16 17 18 19 20 21 22 23 24 25 26 27 28 29 30 -
Recent Posts
goodstatsbadstats.com
Big Data and Wimbledon
 I finished watching the last of the Wimbledon tennis matches yesterday. This years play featured a number of great matches and a large number of surprising results. No one would have predicted a Bartoli vs Lisicki match up for the woman’s final. While the men’s final with Djokovic and Murray was expected the early departure of Nadal and Federer from the tournament was not expected.
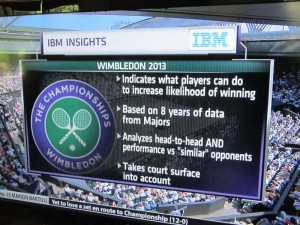
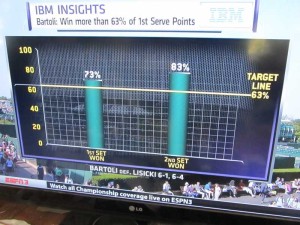
This year IBM, ESPN and the folks at Wimbledon together put together a statistic for each contestant in each match. The graphic on the right gives the description of how they arrived at the statistics. The presentation on ESPN as they showed the matches went under the label “IBM Insights” and claimed to show the likelihood that a player would win a set within a match based on how they did on a measurement of just one of many performance measures for the set. So for example in the Bartoli vs Lisicki match they said that if Bartoli could win more than 63% of her first serve points then the likelihood that she would win the set was 92%. This was an attempt to integrate “Data Analytics” into the commentary.
The problem with this approach is that it is one dimensional. There is a long list of performance measures that impact who wins a given set. This is truly a multidimensional problem. How many points Bartoli wins on her first serve does not matter very much if she can not break Lisicki. For those who do not follow tennis it is common for the server to win a given game. The play is such that the game favors the server. Breaking serve refers to the situation where the server loses that game. Winning six games can win a set – but they have to win by two games. And if they get to six games each then they play what is called a tie break – unless of course it is the third set in the match (for the women, fifth for the men.) Then they play on, at Wimbledon, until someone wins that final set by two games.
 The next issue is that the number itself is not very informative. They picked one point on what is essentially a continuous distribution. So what is Bartoli’s likelihood of winning if she wins 55% or first serve points? if she wins 70% of first serve points?
To the credit of the commentators doing the play by play they mostly ignored the IBM Insights numbers during the match. Rather they focused on what was going on in the match itself and on a wide range of performance measures as the match progressed. They frequently showed comparisons of the two player on several measures as the matched progressed. This was a much more well rounded approach.
Once the match was over sometimes they came back to the IBM Insight statistic and sometimes they just ignored it. They were happy to show the results for Bartoli after she won the Woman’s championship. She had exceeded the standard in both sets in her match. They made no mention of how Lisicki did on her statistic.
 For the men’s final the story was a bit different. Here the target value for Murray was “Win more than 57% of 2nd serve return points.” Then the likelihood of him winning a set was 78%. Here Murray won three sets, Djokovic won none. The commentators never came back to a discussion the IBM Insight statistic after the match. Murray exceeded the target value of 57% in only the second and third set of the match.
If interested the Wimbledon website does have available the performance measures for each match. They are not labeled as “IBM Insights.” And it looks like they actually computed three performance measures for each player for each match. For those interested the match statistics for the Djokovic Murray match are here. And those for the Bartoli Lisicki match are here.
I am left here with the feeling that the value of “Big Data” and “Data Analytics” was not well served with the “IBM Insights” part of the commentary. This is a case where the situation is much to complex to be summarized in a single number. It would have been better to have left it out entirely.
Posted in Statistical Literacy, The Media