Subscribe to Blog via Email
Good Stats Bad Stats
Search Text
July 2026 S M T W T F S 1 2 3 4 5 6 7 8 9 10 11 12 13 14 15 16 17 18 19 20 21 22 23 24 25 26 27 28 29 30 31 -
Recent Posts
goodstatsbadstats.com
Uninformative Analysis – How useful is the Washington Metro?
 Combine a poorly designed question with a poor analysis and what to you get?
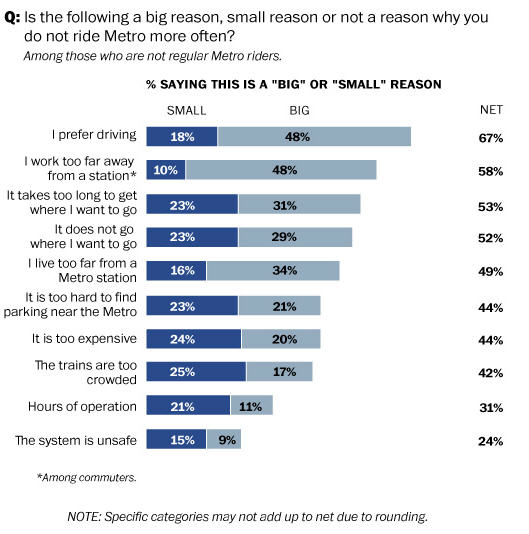
Last week the Washington Post conducted a survey on the Washington area Metro asking questions about attitudes and reasons for not using the system. A piece of the graphic they used to display the data is posted on the right. The article itself did not rely too heavily on the graphic.
Typically questions like “Is the following a….” are administered as a series of questions. The main question is repeated for each of the categories of interest to the survey designers. The order of the categories, as they are given to the respondents, is frequently randomized to avoid the inevitable biases the people have to focus on the earlier items in the list.
The problems here are many. The main issue is that it is very difficult to include all of the relevant important possible answered to the question. This question is directed towards those who are not frequent users of the Metro system. I fall into that group, yet my reason for not using the system is not among the list of reasons given. I generally do not go into downtown DC. That would be my main reason for not using the system. However when I do go into DC I prefer to use the Metro. I don’t have to deal with parking, traffic, and the over abundance of speed cameras that DC has installed. It is not that I am against the speed cameras, but with $100 plus fines and multiple cameras on the same road I don’t want to be caught having to watch the speedometer incessantly when I should be paying attention to traffic. I call that distracted driving.
A second problem is how to I respond the the later items once I have said that an item is a “big” issue for me. People approach that problem differently. Some think there should be a minimum of “big” issues. While others have no reservations about giving a long list of “big” issues. This makes the analysis of the answers to the question very complex. But also what is a “big” issue. Take the answer “I live too far from a Metro station.” There are people who take a 15 mile commuter bus ride, or drive 20 miles to the Metro station. A better but more complex description would be along the lines “it is too difficult to get to a Metro station.” But even that does not provide adequate data as the follow-up question would need to look at the reasons why it is too difficult.
Lastly the question is one that give a multidimensional answer set while the graphic provides a one dimensional view of the situation. The questions on the distance of the Metro station from my home and from my work site form a pair. Being too far from one of those place is a different situation than being too far from just one of them. Cross tabulations are important. Perhaps the Washington Post felt that such analysis was beyond the ability of their readers to understand.
This issue with the graphic reminds me of a homework problem my son was given when he was in 3ed grade. The problem started with a table. In the columns was a set of schools. The rows listed different items that were recycled – newspapers, aluminum, glass, etc. In each cell of the table was a count of the number of students in each school who recycled each item. The math problems for the students, based on the table, took the form “how many students recycled items at school A. Or how many students at school A recycled aluminum and glass. Unfortunately the answers were unknowable based on the data in the table as students were recycling multiple items at each school. This was obvious from the table as they provided a count of the number of students at each school and the sum of the counts of the number of students recycling the various items at the school was always greater than the number of students at the school. When I pointed out the problem to the teacher her response was she was just trying to teach the students how to add. I told her she was also teaching bad math at the same time. She was still using the same question in her classroom two years later.
When students are taught math and statistics like my son was in this case then years later the reporter makes the mistake of failing to understand when a one dimensional analysis does not explain what is going on in the multidimensional world.