Subscribe to Blog via Email
Good Stats Bad Stats
Search Text
May 2025 S M T W T F S 1 2 3 4 5 6 7 8 9 10 11 12 13 14 15 16 17 18 19 20 21 22 23 24 25 26 27 28 29 30 31 -
Recent Posts
goodstatsbadstats.com
Global Warming and a Random Walk Model
Matt Asher at his Probability and Statistics Blog posted a piece titled “The surprisingly weak case for global warming.”
Given all of the research and data available it is hard to conceive of someone making such a claim. Last I heard even some of the opponents argument has gone from the denial of the reality of global warming to arguing about the reality of human caused global warming. Matt uses one set of data covering the period from 1881 to 2001 provided online by NASA. This pales in comparison to the amount of data covering 2000 years from multiple sources that the serious climate researchers are utilizing.
The model proposed for analysis in the posting describes the Earth’s climate as a very simple random walk. This claims that next year’s temperature is this year’s temperature plus a change term which is a random variable. That means that if this year’s temperature was usually high then next year’s temperature should also be expected to be high and the temperature is just as likely to increase next year as it is to decrease next year.
Nowhere in the posting or the analysis is there any consideration at to the appropriateness of the random walk model to the physical factors that influence the climate of the Earth. Models are useful but they must be grounded in the real world with some basis of justification. The basic question “is this an appropriate model” was not asked.
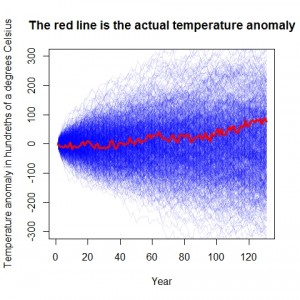
What did the modeling show?  The plot similar to the the one in the original post is shown on the right. The solid red line depicts the temperature trend over the last 131 years. The trend line is apparent and is not something that is seriously questioned in the literature. Fitting a very simple linear regression to the data will yield significant results. The light blue lines depict 1000 simulation under the random walk model which assume the same year to year variability that is in the original data. Noting the wide range of results in the simulations the author claims that it is clear that the actual trend line is well within what could be expected under normal temperature variation under the random walk model.
It is at this point that the author notices the first piece of information that indicates problems with his model. He next examines the data and observes a negative year to year correlation in the changes in temperature. Explaining this he says:
what does a negative correlation mean in this context? It tells us that if the earth’s temperature rises by more than average in one year, it’s likely to fall (or rise less than average) the following year, and vice verse. The bigger the jump one way, the larger the jump the other way next year (note this is not a case of regression to the mean; these are changes in temperature, not absolute temperatures). If anything, this is evidence that the earth has some kind of built in balancing mechanism for global temperature changes,
He had the opportunity at this point to question the appropriateness of his model. The data is telling him that there is a problem but he is not seeing it. Instead he goes on to refine his modelling of the random walk to incorporate the negative correlations. He much too easily dismissive the idea that regression to the mean is a real phenomenon because he is dealing with change estimates rather than with the actual data. In fact his statement “this is evidence that the earth has some kind of built in balancing mechanism for global temperature changes” is recognition that regression to the mean is likely present.
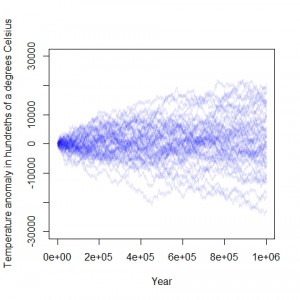
 On of the problems in using a random walk to model temperature trends on the the Earth is they have the unfortunate property of tending to wander off to the extremes. The author had modeled the temperature over a 131 year period. By extending the modeling period to a much longer time line the problems with the model assumptions become readily apparent. The plot at the right does just that. It shows the results using the same model data and the same code that the author used to generate his models with the time frame extended back one million years. At the extreme some of the simulations show changes of 200 degrees Celsius over that time period. With an increase of only about 80 degrees Celsius the oceans would boil off. A drop of similar magnitude would result in a snowball Earth. The models of the temperature history of the Earth over the last million years are more on the order of 10 degrees Celsius. This clearly shows that the random walk model as implemented by the author show more variably in the Earth’s climate over time than can be matched to the historical record. A plot of the estimate temperature deviations over the long term can be seen here, here, and here.
Posted in Methodolgy Issues
Nice explanation. Thanks!
Hi Larry,
Not sure if you saw the reply to my comment over at statisticsblog.com:
Note that I never claimed this method could be extended to an indefinite number of years. In general, models (or simulations) that are good over specific ranges are the norm for what we do, not the exception, no?
If you did a study of some students and found that the scores they got on their test could be modeled well with a straight regression line, should you reject that model because extending it to a student who studies 50 hours would predict the nonsensical result of 120% on their test?
Matt,
Thanks for the comments.
I did see your reply and felt that others had adequately responded to it. So I felt no need to do so also.
You are right you did not claim that the model extended beyond the 131 years of data your have. However your null hypothesis is a stationary time series. That implies that extensions beyond 131 are reasonable as long as other conditions remain unchanged.
Take you example with the students. You are right I would not expect the model to work well if the data used to fit that model only included those who studied 10 hours or less. At 50 hours the model is not likely to perform very well. However if I applied the model to a different set of students from the same population with characteristics in the range that the model was developed with then I would certainly hope that the results would be valid for the new set of students. I think that is what is being done when one extends the time period beyond the original 131 years.
Larry
“However your null hypothesis is a stationary time series.”
No, Matt’s model is not a stationary process. It’s a random walk, so if you run it for a long time, T, the expected deviation from where you started will be of order sqrt(T). So it does not make sense to apply his model over thousands of years. You have shown this here, and he has stated it on his blog, so you are in agreement 🙂
He could modify his model in some way to make it a stationary process.
Cheshire,
Thanks for the comments and your observations.
I think we are talking about two things here. What Matt said early in his posting was that he was going to evaluate the claims that the Earth is warming and that warming is part of a long term trend – his GW1 and GW2. When he sets up his model and his testing he uses the random walk model. You are correct when you say that model is not a stationary process.
However in reporting his initial results he claims that “this test finds zero evidence of a global warming trend.”
What he is saying there is that he is actually trying to test against a null hypothesis that there is not trend, there is no global warming. This is where I have been trying to say that his null hypothesis is of a stationary process. It was not my intention to imply that his random walk model was a stationary process. Perhaps that was not clear.
To put it all together, the underlying claim is that the temperate of the Earth is stable over time, is a stationary process. Matt has used a random walk model which is not a stationary process to model this situation. Many of us have been saying for various reasons that the model he has used for the testing is not appropriate for what he is testing for.
Applying his model over a long period of time was the mechanism I decided to use to demonstrate that his methods were not appropriate to the issue of global warming.
I agree that Matt’s wording was a bit provocative. If it was designed to attract comments, it was successful! Perhaps he should have stopped at “we have no reason to reject the null hypothesis” (that the last 130 yrs is consistent with a random walk). And I agree that the model could be improved to make it more realistic. Perhaps he will do that in a future post.